
The “NAEP scores” or the Nation’s Report Card was issued the last days of January, two months ago. Many of you may have seen the headlines about how poorly the country as a whole is doing post-Covid. If you look more closely, it is really since 2017.
What are the NAEP scores and how is Pinellas doing?
(The National & State picture is first, then Pinellas. Be sure to get to Pinellas.)
Here are a few general facts:
NAEP stands for National Assessment of Educational Progress, and it is pronounced “nape” when people speak of it.
It is administered by the National Center for Educational Statistics (NCES) which I mentioned in my recent letter about the key three ways the USDOE impacts education.
NAEP assessments are congressionally mandated and have been performed over the last 50 years covering a variety of subjects and grade levels.
They give national and state level amalgamated data; they do not provide county, township or school-level data.
Every 2-years the Main NAEP is given to students enrolled in grades 4, 8, and 12.
Reading tests began in 1992
Math tests began in 1990
2019, 2022, and 2024 were Main NAEP administration years
Approximately every four years a Long-Term Trend (LTT) NAEP is administered based on a student’s chronological age (ages 9, 13, and 17)
LTT NAEP results go back to 1971 for Reading and 1973 for Math
2020, 2023, and 2025 were LTT NAEP administrations; more frequently to measure pandemic recovery efforts
All students at all schools do not take the NAEP. For instance, in Pinellas, 3 schools (out of 128) participated in 2022; 9 schools in 2024 and 5 schools in 2025. All public schools, no private schools, no homeschooling. (I have not ever seen public reporting on their data. Many people assume private schools are “better” than public schools, but how does anybody really know?)
These are the charts for the National and State data for 4th and 8th grade Math and Reading and highlight the scores in 2022 and 2024: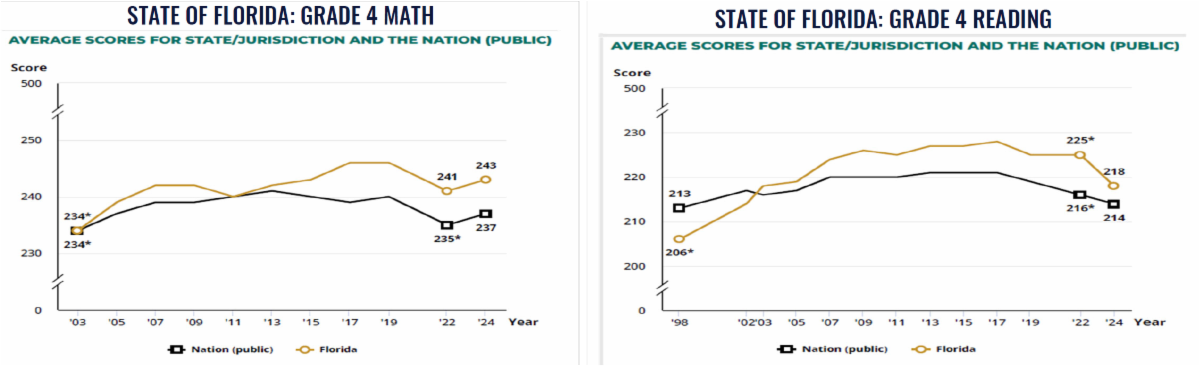
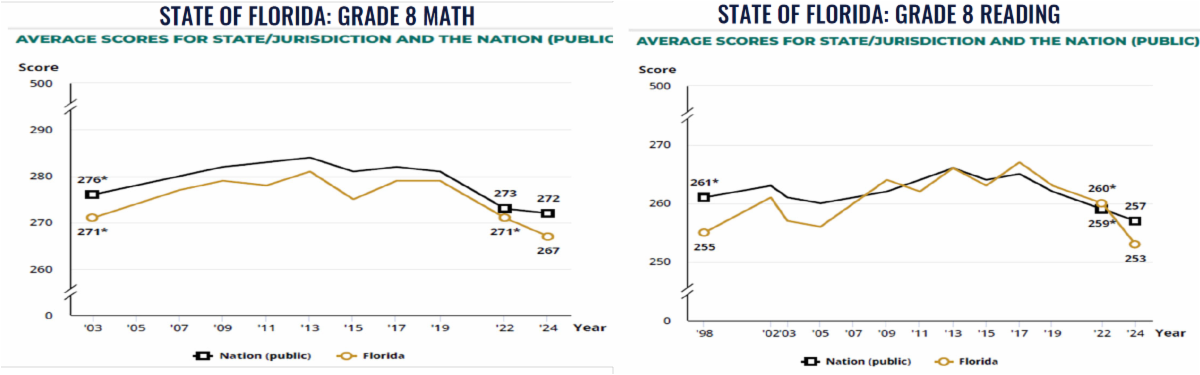
No one wants to see a decline, ever, so these charts are not good. One thing I notice is that the national and state declines actually started in 2017… not since 2020. I also notice that the deviation is not wildly off over time which is interesting to note. And I have to ask: what does a 272 out of 500 mean? Does it mean what it appears to mean: overall average? You have super-high-performers, average-performers and low-performers and they average out to 272? What does under 272 mean? Are those students illiterate, or unable to add and subtract? I have always asked those questions about the Florida state accountability tests as well. We are graded on “proficiency” which is a 3 or above on a 5-point scale; it is called grade level proficiency. What does it mean if a child scores a 2? Are they illiterate? The answer to that is a resounding “no”. Still, we have to measure and chart and show progress or decline over time as a group, and individually for students as well. This is important for student performance, yes, and it is also important as a critical industry to analyze and assess what is working and what is not.
Let’s talk about Pinellas County Schools.
While results directly from NAEP are not available by county, three universities (Stanford, Harvard and Dartmouth) correlated the NAEP results with local performance on state assessments and were able to statistically demonstrate performance across the pandemic recovery period 2019-2024. This is the link to the full study should you like to read it.
This first chart is Math performance between 2019-2024, comparing counties in Florida. 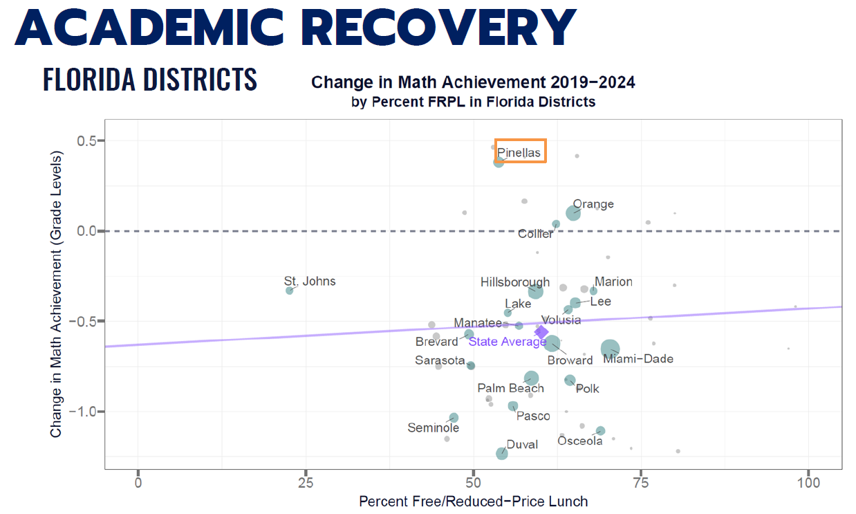
The x-axis is the percentage of free and reduced lunch students (FRL); the further your district is to the right, the more students you have on free or reduced lunch; the further to the left, the more affluent your district is. The size of the dots themselves represents volume of students; the larger the dot, the more students and vice versa. The dotted line at 0.0 represents full recovery, or essentially that in 2024 students are performing at the same level as students were in 2019. The purple line represents the average and trend of districts across the state of Florida. On the y-axis, each tenth, or 0.1 is one month of learning. The negative 0.5 means that on average, Florida students are half a year behind in mathematics compared to where they were in 2019. (There are 10-months of school, so 5 months is a ½ year.)
You can see where Pinellas is; on average, Pinellas students are a half a year ahead in mathematics compared to where they were in 2019.
This is the Reading performance between 2019-2024, comparing counties in Florida. 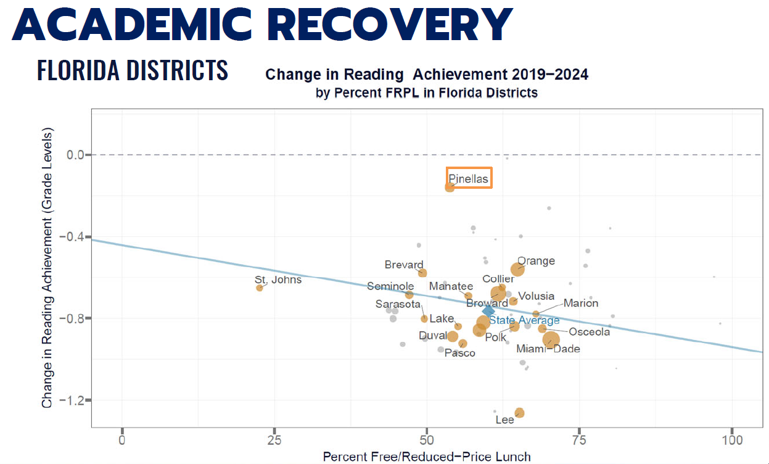
It is good to see Pinellas outperforming across the state, yes, though we are not satisfied. On average, Florida students are eight months behind in reading compared to where they were in 2019. On average, Pinellas students are a 2 months behind in reading compared to where they were in 2019.
While state education leadership essentially shrugged their shoulders the results, there must be more done to support best practices across school districts. Why is Pinellas doing so well comparatively? It is no doubt because of the investment in Early Literacy over the last 5-6 years, studied and launched pre-pandemic.
Two things happened at about the same time:
PCS updated the way we teach reading as a whole, recommitting to phonics while maintaining the best elements of balanced instruction, and
the Pinellas Education Foundation invested in the Pinellas Early Literacy Initiative at our 8 lowest performing schools (and has since expanded to 16, plus professional development of the key tools to all Pre-K-2 teachers).
Last year our 3rd Grade reading rate improved by 8 percentage points overall, and these were the improvements over time at those 8 schools: 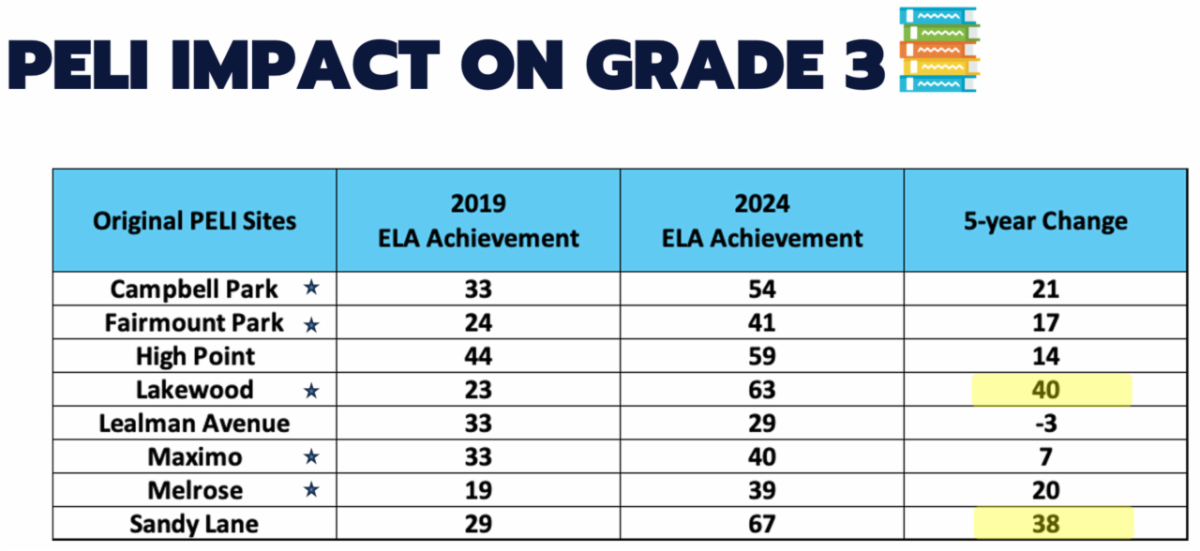
That is a percentage-of-students improvement, not number of students. That kind of improvement over 5 years does not just impact one or two students, it changes a community over time.
As students become stronger readers at an early age, their academic achievements will continue to grow. Also, please let me mention again: when we say that Lakewood Elementary 3rd Grade Reading is at 63% (or Pinellas County Schools for that matter), that is 63% scoring Level 3 or above. That does not mean that the other 37% of students cannot read. I can validate that because my youngest son has gotten 2’s on his state reading tests before and he can read anything you put in front of him. You know what he doesn’t like to do? Take tests. Do we want it to be 100%? Absolutely. And we will keep working to that end.
How does Pinellas compare across the country with respect to pandemic recovery?
The Council of Great City Schools which looks at larger urban districts across the country provided this analysis: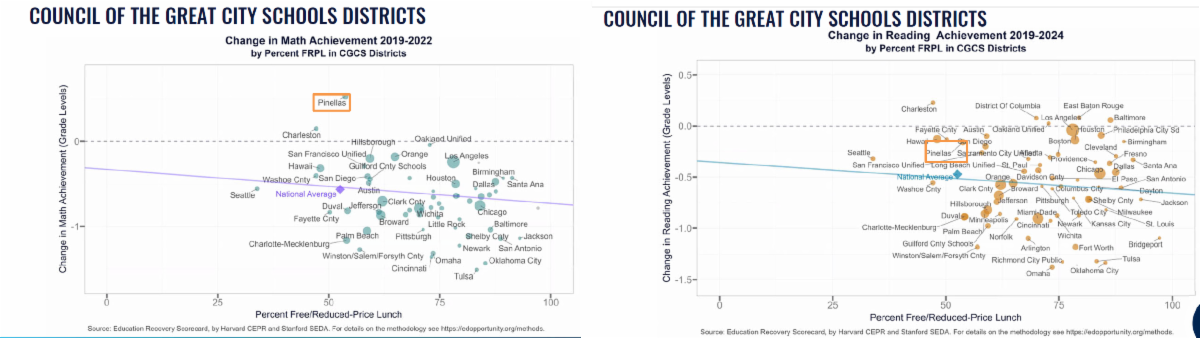
The data provided in this newsletter demonstrates a number of things, but one thing it does demonstrate is that Pinellas County Schools invested the ESSER/ARP funds provided to school districts to mitigate the impacts of Covid on learning very well. All told, we received nearly $300M over 4 years. Key areas that they were invested were: a good deal of summer programming, one-to-one with computers for learning at home, invested in online learning programs, invested heavily in one-on-one tutoring. We did many innovative things: some of them worked, some of them did not. The ones that PCS believes have worked, we are working to continue like the Early Literacy Initiative, for example. I recently asked our district leadership: of the items we have to reduce, which had the most impact and do you wish we were able to continue? The answer was: tutoring, higher investment in professional development for teachers and the expanded summer programs.
I hope this newsletter gives you some insight into NAEP, into Covid Recovery and into Pinellas County Schools. More to come on PCS enrollment and Florida education funding.
My best, 
*While I serve on the Pinellas County School Board, these writings and opinions are my own.